Lessons learned in canvas apps performance while integrating Azure SQL, Power Apps and Power BI
In my last two projects, I was asked to create a Power BI dashboard with write-back functionality. This is a common request from users, an innocent question of “oh, let me change that number (in Power BI)” or “let me add row there”. Rise in low-code tools, such as Power Apps, has allowed for the write-back functionality to be embedded in Power BI Dashboard.

All the functionalities work fine for small data sets (~20 rows), but add few more records and the canvas app becomes a loading bar simulator.

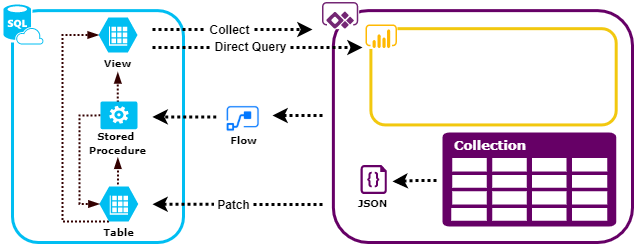
In a series of post, I will be outlining how I maximized the performance of a canvas application for the following functions:
- Read: Reading data from SQL and displaying it in Power Apps
- Write: Improve Power Apps to SQL Performance
- Calculate: Apply calculation using function, views, and/or stored procedures to datasets
- Refresh: Refresh datasets in Power Apps and Power BI
I will continue to post any new techniques I learn on Power Apps performance. If you have other tips-and-tricks you would like to share, please leave a comment below!
Be First to Comment